
Customer Success Metrics MSPs Should Track in 2025
The key indicators MSPs need to measure in order to improve retention, strengthen relationships, and drive long-term growth.
Why Metrics Matter for MSP Customer Success
Customer success for MSPs is no longer about “checking in” and hoping clients are happy. In 2025, it is a data-informed discipline. As the TSIA explains, CS has become essential for proactively managing churn, renewals, and expansion. The MSPs that win are those who can quantify risk, satisfaction, and value—then act on those signals before churn or dissatisfaction surfaces.
Tracking the right metrics helps you move from reactive to proactive. Instead of guessing which clients are at risk or ready to expand, you have concrete indicators that guide where to focus time and resources. That clarity, emphasized by Fullview as essential for understanding risk, is vital for predictable renewals, upsells, and long-term growth.
1. Logo Retention and Revenue Retention
At the foundation of any customer success program are two core metrics:
Logo retention: the percentage of clients who stay with you over a given period.
Revenue retention: the percentage of recurring revenue you retain (and ideally grow) from your existing base.
Logo retention tells you if clients are leaving; revenue retention tells you how much value you are protecting and expanding. LinkedIn identifies customer churn rate and Net Revenue Retention (NRR) as fundamental indicators of CS impact. High revenue retention with flat logo retention often means you are growing within your base. Low numbers in either category are a clear signal that something is off in how value is experienced or communicated.
Why it matters: Retention is the single biggest lever in an MSP’s recurring revenue model. Even small improvements here compound into significant long-term growth, as noted by Product School.
2. Onboarding Health and Time-to-Value
The first 90 days of a client relationship heavily influence how the rest of the journey feels. Two vital onboarding-related metrics, detailed by Supademo, are:
Onboarding completion rate: percentage of clients who complete your defined onboarding milestones on time.
Time-to-value (TTV): how long it takes a new client to experience their first meaningful outcome (fewer issues, improved workflow, visible security improvements, etc.).
If onboarding constantly drags or feels chaotic, trust erodes early. Tracking these metrics highlights where handoffs break, tasks stall, or expectations are unclear. Docebo explains that improving them typically results in happier stakeholders, smoother adoption, and a stronger platform for future expansion.
Why it matters: A fast, predictable onboarding builds confidence and accelerates the point where clients can clearly see why working with you was the right decision.

3. Customer Health Scores
A customer health score is a composite indicator that blends several signals into a simple view (often green/yellow/red). For MSPs, a robust health score, aligned with the multi-dimensional models supported by KoalaFeedback, may include:
Ticket trends (volume, recurrence, severity).
Environment stability (alerts, backups, security posture).
Adoption of key tools and workflows.
Engagement (attendance at reviews, responsiveness, stakeholder sentiment).
The goal is not perfection but consistency. A well-defined health scoring model helps your team quickly see which accounts need attention and why. Forbes specifically calls out health scores as leading indicators of renewal performance.
Why it matters: Health scores make risk and opportunity visible at a glance, enabling proactive outreach instead of surprise cancellations.
4. Ticket and Incident Trends
Support metrics have always been part of MSP operations, but in customer success they are interpreted differently. Instead of focusing only on speed, you also look for patterns:
Key views, often paired with sentiment measures as recommended by Contentsquare, include:
Ticket volume per user or per device (is a subset of users or systems overburdening support?).
Repeat issues (signal of underlying process or training gaps).
Time between similar incidents (are fixes sticking?).
Rising ticket volume or recurring themes within an account often indicate poor adoption, misaligned tools, or unresolved root causes. Conversely, decreasing volumes alongside stable systems can be a sign your work is paying off.
Why it matters: These trends show whether you are actually improving the client’s day-to-day experience, not just closing tickets fast.
5. Product and Service Adoption
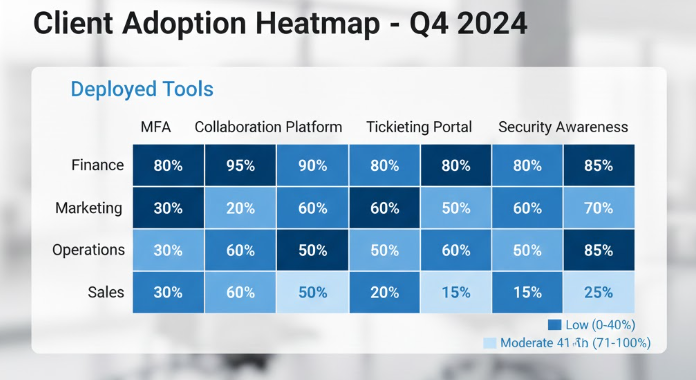
If your clients are not fully using the tools and services you have deployed, they will eventually question the spend. As Tomasz Tunguz notes, adoption rate is a key leading indicator. Key adoption metrics might include:
Percentage of licensed users actively using a given tool.
Utilization of core features that tie directly to value (e.g., MFA, automation rules, collaboration spaces).
Adoption of standardized workflows or SOPs introduced by your MSP.
Low adoption is both a risk and an opportunity. Addressing it through enablement, documentation, and process adjustments can drive user satisfaction and unlock upsell potential. Top Customer Onboarding Metrics to Prioritize in 2025 details product and feature adoption rate as essential metrics.
Why it matters: Adoption is where perceived value lives. High adoption usually correlates with stronger renewals and easier expansion conversations.
6. Engagement Metrics (Meetings, QBRs, Async Touchpoints)
Engagement tells you how connected your client is to your MSP beyond the helpdesk. The CS Café highlights that customer engagement scores are key early indicators of account health. Useful metrics here include:
Attendance and participation in QBRs or strategic reviews.
Response rates to surveys or feedback requests.
Engagement with async updates or shared workspaces (views, comments, follow-ups).
Dropping engagement—missed meetings, slow responses, no questions—can be an early churn signal. Conversely, high engagement often tracks with healthy relationships and openness to future initiatives.
Why it matters: Engagement is a leading indicator of relationship health and a critical early-warning signal before formal dissatisfaction appears.
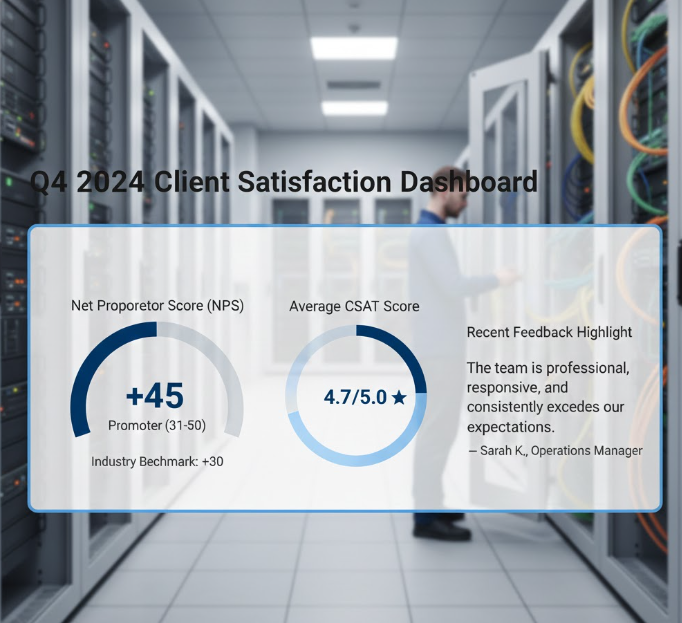
7. Satisfaction Metrics (NPS, CSAT, CES)
While not unique to MSPs, satisfaction metrics remain important. Sprinklr emphasizes that these must be combined with operational data to understand the full picture:
CSAT (Customer Satisfaction Score): after key interactions or projects.
NPS (Net Promoter Score): to gauge loyalty and likelihood of referral.
CES (Customer Effort Score): to understand how easy it is to get help or complete key tasks.
These scores give clients a simple voice in your data set. A dip in CSAT after a major change can highlight where communication or training fell short. Top Customer Success Metrics and KPIs lists these as essential.
Why it matters: Satisfaction metrics help you spot where “numbers look fine” but people do not feel great, informing where improvements are needed in the customer experience.
8. Expansion and Referral Indicators
Since customer success is about long-term value, you should also track how often relationships grow. The State of Customer Growth and Renewal 2025 explores how expansion revenue and renewal rates are tracked together to understand CS impact. Useful metrics here include:
Number and value of expansions (new services, add-ons, or increased scope).
Time from onboarding to first expansion.
Number of referrals and introductions generated by each account.
These indicators show how much trust and perceived value you have created. Healthy, well-served clients are more likely to invite you into new areas and recommend you to peers. The Top Customer Success Metrics & KPIs for 2025 includes upsell and cross-sell rates as key indicators.
Why it matters: Expansion and referrals are where customer success clearly connects to top-line growth and operating leverage.
Pulling It Together: A Simple CS Metrics Blueprint
To avoid overwhelm, MSPs can start with a focused CS metrics set that covers:
Retention: logo + revenue.
Onboarding: completion + time-to-value.
Health: composite score with support, stability, adoption, and engagement.
Satisfaction: periodic NPS or CSAT.
Growth signals: expansions and referrals.
From there, refine based on what best predicts your real-world renewals and upsells. The goal is not to track everything—it is to track the few things that give your team a clear, shared understanding of which relationships are thriving, which are at risk, and where the next growth opportunities lie.
Ready to stop reacting and start predicting?
See how Prioriwise turns your delivery data into a live Relationship Health Score for every client.
Get Started